Data Visualization for Business 2 - Plots for Publication
Level: Intermediate, some experience required
Keywords: R, Data Visualisation, Business Data, Publication
Note: Please see Prerequisite Section Below
View Session Slides - Opens new Tab
Download Session Files - Downloads .zip file
Session Summary:
Although correctly displaying information is important, preparing plots for publication or distribution can arguably considered equally important. During this hands-on practical workshop, we will dive into the more technical aspects of preparing data visualisations for publication including:
- Specifying visual space: themes, their defaults and how to adapt them.
- Specifying axis’s: scales, breaks and designs
- Specifying Labels, Titles, annotations and additional points.
- Specifying Layouts: ggarrange vs faceting
Session Objectives:
- Understand how to apply good data visualisation practices to publish plots
- Understand the flexibility of ggplot, and how to utilize this flexibility in producing publishable plots
Transferable Skills:
- Using the tidyverse, in particular ggplot
- Advanced functions in ggplot, relating to specific graphical customization
- Creating standardized plots for publication
Prerequisite Knowledge:
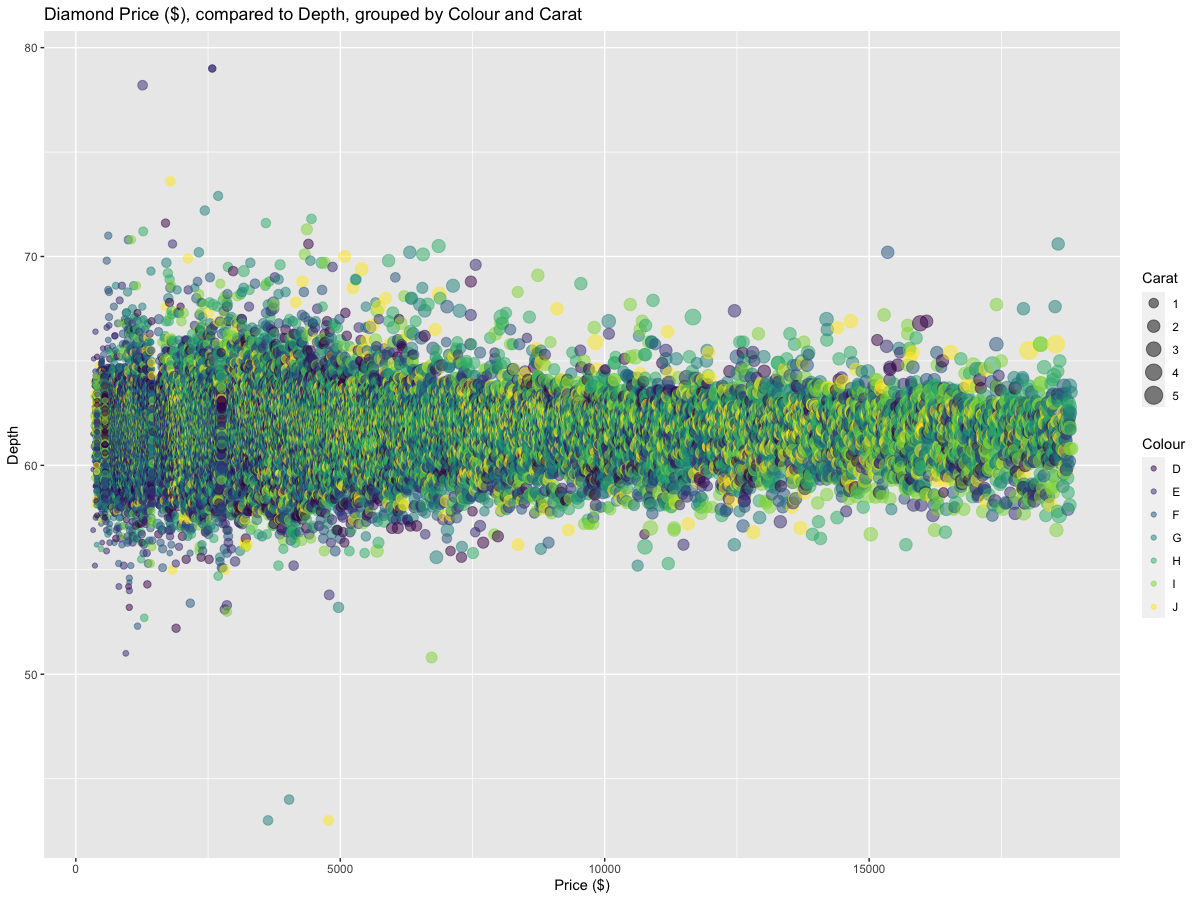
Participants are must have attended Data Visualization for Business in R: An Introduction, or have sufficient knowledge to reproduce the graphic below:
Prerequisite Content:
Access to R & Rstudio (R’s Graphical User Interface, or RStudio Cloud (Free Online)), Provided ZIP File .zip